Every January I like to publish a post sharing lots of different info and stats relating to our travel from the previous year; that includes both our 50 state road trip and overseas travel.
For reference, here are our posts for previous years:
Here’s a roundup of all our stats for 2023.

Miles Driven
We started 2023 with 191,930 miles on our car’s odometer. At the end of the year we were at 211,751 miles which means we drove 19,821 miles in 2023. That’s the second lowest number of miles we’ve driven in a year on the road trip. I’ve a feeling 2023 will rival the first two years of our road trip for how many miles we drive as we’re starting the year on the east coast and will end the year on the west coast, with a trip up to and around Alaska in between which will add a whole lot of mileage.
For comparison, here’s our mileage from previous years:
- 2022 – 21,469
- 2021 – 20,059
- 2020 – 18,375
- 2019 – 25,006
- 2018 – 27,643

Number Of Countries Visited
Shae and I have different numbers for 2023 because I went abroad without her for the Frequent Miler Party of 5 challenge. Shae went to three countries, while I went to nine.
Shae
- Mauritius
- South Africa
- Qatar
Stephen
- Mauritius
- South Africa
- Qatar
- Philippines
- Macau
- Japan
- Chile
- Argentina
- Brazil

I was in two minds as to whether we should include Qatar seeing as we didn’t actually do anything there as it was a stopover on our way back to the US from South Africa. However, we did stay overnight and left the airport, so it (sort of) counts.
Number Of Cities Stayed In (Officially)
We have slightly different numbers again for this due to my extra international travel, although while I was away on that trip Shae was away on a different trip where she visited quite a few places. That meant our totals weren’t too different – Shae stayed in 56 cities, while I stayed in 57.

Number Of Cities Stayed In (Unofficially)
58 for Shae and 59 for me. This total is slightly higher than the previous numbers as it includes cities we stayed in a night or two while moving from one place to another.
Number Of States Visited (Officially)
12 – North Carolina, Arkansas, Missouri, South Dakota, Minnesota, Michigan, New York, New Hampshire, Massachusetts, Maine, Vermont and New Jersey.
Vermont is a little different as we’d officially done that in 2018 and 2019. However, we spent a week there this fall and did quite a few new things and so it feels like we officially visited it again even though it wasn’t a new state.
Number Of States Visited (Unofficially)
21. The other 9 states were just ones that we stopped over in for a night or two or where we’d visited before.
Number Of Hotel Brands Stayed At

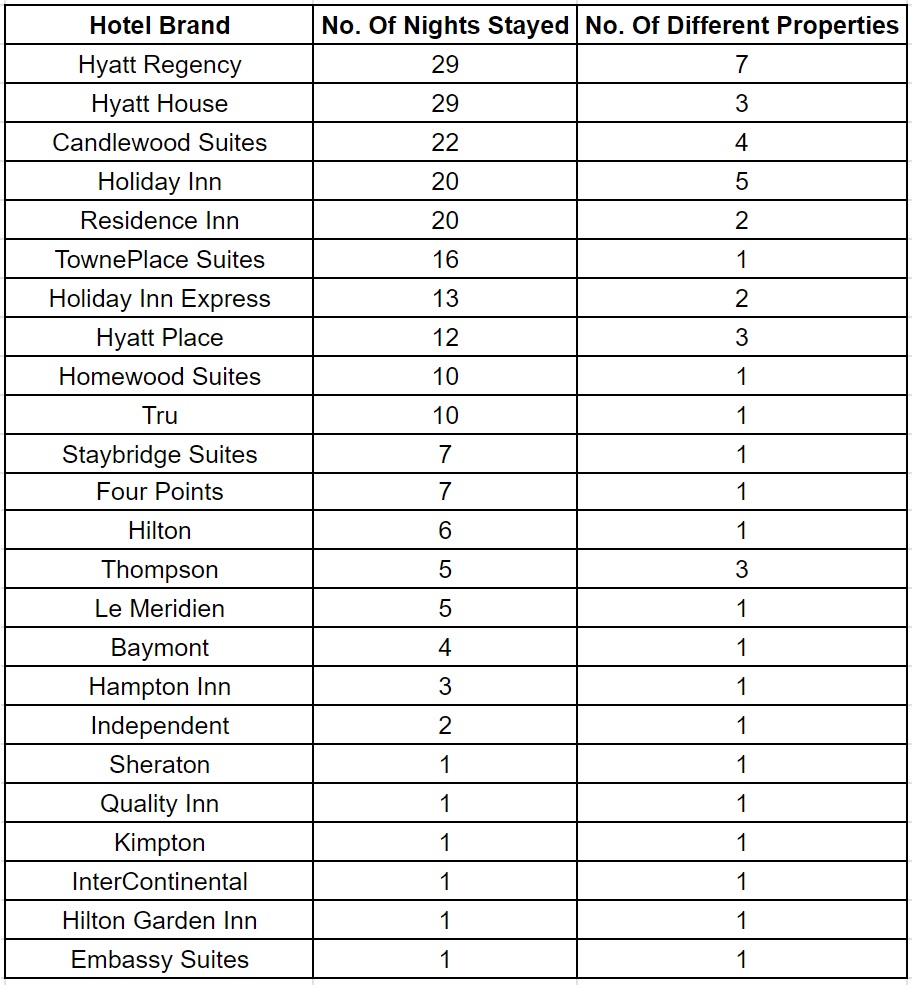
24. That’s fewer than we stayed at the previous year, but it did include a few new-to-us brands like Tru, Hilton Garden Inn, Le Meridien and Thompson (well, Thompson was new to me – Shae had stayed at one before).
Here’s a list of how many nights we spent at each brand:
Number Of Nights In Airbnbs & Vacasa Properties

100 in Airbnb properties and 19 in Vacasa properties. That’s more than double our total from 2022 of 53. One reason we spent so much time in Airbnbs and Vacasa vacation rentals in 2023 is because we’ve started valuing even more having a separate bedroom and living room. Another reason is that my parents joined us for a month and so those type of homes worked out much better for the four of us. A third reason is that it sometimes meant we could afford to stay more centrally than we would’ve been able to with an equivalently located hotel.
We currently have 47 nights booked at Airbnbs through the middle of this year and I imagine we’ll end up at 100+ nights at Airbnbs and Vacasa rentals by the end of 2024.
Average Accommodation Cost

$47.90 per night which is the highest average amount we’ve spent on accommodation on the road trip so far. Part of that increase will be due to inflation last year, but some is due to the fact that we had an increase in how many nights we paid cash for our stays rather than redeeming hotel points and free night certificates. To be honest, it’s felt like we’ve spent more than an average of $47.90 per night each month, so it’s interesting that we’re still managing to limit it to less than $50 per night.
For comparison, our average accommodation spend in 2021 was $38.77, in 2020 it was $42.67 and in 2022 it was $43.52. That’s still not as good as 2019 though when our average nightly spend was $24.79.
If you’re wondering how we can afford to spend so relatively little per night on hotels and Airbnbs, it’s because we have a good stash of hotel points which reduces our average nightly cost.
Paid Nights Vs. Award Nights

We paid cash for 154 nights in 2023 and used points or free night certificates for 176 nights. That doesn’t add up to 365 because I’ve only included hotels and Airbnbs we stayed at on the road trip, not the hotels we stayed at while overseas or when we stayed with family and friends.
Hotel Points Earned

In case you’re wondering how we earn so many hotel points, check out this post as it’s not just from the fact that we have so many hotel stays. In addition to those methods, in some cases we’ll book a stay, cancel it and then rebook a different stay. The points we get back from cancelling the stay get accounted for in our earnings, as do both redemption transactions, so in those instances we’re effectively double counting. That doesn’t happen too often though and it would be a lot of work to go through to try and work out when that had happened.
With IHG, we bought quite a few of their points, plus we cancelled and rebooked quite a few stays, so those are the two main reasons that figure is almost at 1 million points! For Hyatt, some of the amount shown there is from cancelled stays where we’ve then redeemed those same points for other stays. We’ve also transferred quite a few points in from Chase Ultimate Rewards as the World of Hyatt program is a transfer partner.
- IHG One Rewards – 939,637
- Hilton Honors – 778,526
- Marriott Bonvoy – 338,205
- World of Hyatt – 1,495,356
- Choice Privileges – 152,986
- Wyndham Rewards – 693,791
- Hotels.com OneKey – $0
- Chase Ultimate Rewards – 616,976
- Capital One – 337,214
Hotel Points Redeemed

In a number of cases here, you might notice that we redeemed more points than we earned in 2022. That’s because we already had a healthy balance of hotel points coming in to 2022, so it’s not like we’re overdrawn on our points balances.
- IHG One Rewards – 1,359,400
- Hilton Honors – 1,230,000
- Marriott Bonvoy – 132,000
- World of Hyatt – 1,483,000
- Choice Privileges – 38,000
- Wyndham Rewards – 658,500
- Hotels.com OneKey – $0
- Chase Ultimate Rewards – 1,136,000
- Capital One – 341,864
Total Pet Fees

We were due to pay $3,360 in pet fees at hotels in 2023. We were fortunate that quite a few properties didn’t end up charging the fee as what we actually paid was $1,999.80. That’s still a painfully high amount, but certainly not as bad as it could’ve been.
Hotel Status Levels
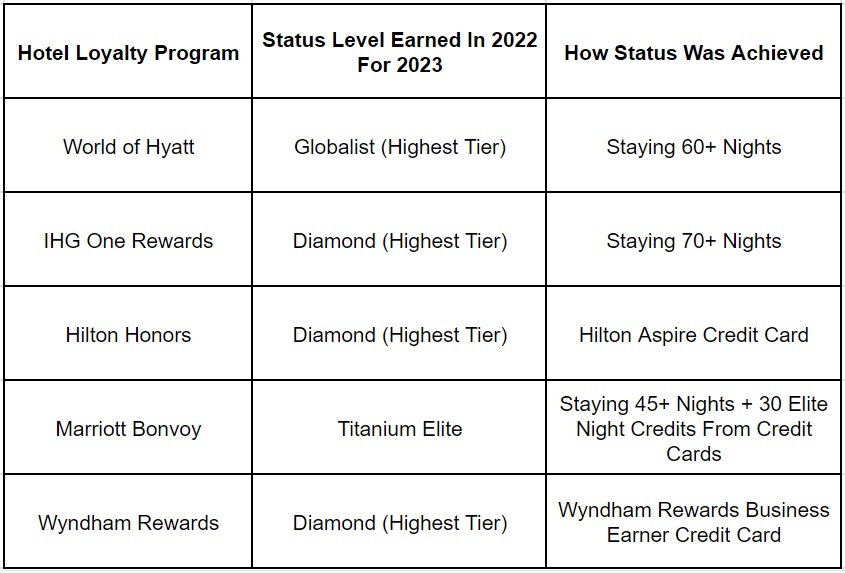
In 2020 and 2021 hotel chains eased their status earning requirements due to COVID. Things went back to normal in 2022 and continued that way in 2023, so in theory it was harder to earn status again.
However, seeing as we live in hotels, it was still easy to retain top-tier status with most hotel chains. That was usually done via stays, although with Hilton that was achieved simply by having their Aspire credit card which gives Diamond status among many other benefits.
Average Daily Spend

We spent $43,915.49 in 2023, but we’d budgeted for $41,937.50 due to spending some of the year overseas. That means we overspent by $1,977.99, or less than $6 per day too much. When looking at it that way it doesn’t seem too bad, but hopefully we can get back on track in 2024 and underspend – or at the very least stick to our budget – over the course of the year.
Number Of Blog Posts Published
We published 135 blog posts in 2023. That’s more than we published in 2022 which I’m a little surprised by because it didn’t feel like I was writing quite as frequently last year. That said, Shae helped pick up some of the slack and I think she published more posts in 2023 too which helped.
Total Page Views
We had 257,384 pageviews in 2023 versus 246,197 in 2022, 341,825 in 2021, 235,599 in 2020, 304,588 in 2019 and 160,788 in 2018. It’s nice that there was a slight increase in readership, but it’d be even nicer if we can increase readership by an even greater number in 2024!
Question
Are there any other numbers you’re curious about from the sixth year of our road trip? Let me know in the comments below and I’ll try to provide them 🙂
[…] 2023 […]