Something I thought would be interesting to do on our 50 state road trip is to publish our stats each month.
We’ve now been on the road for 31 days, so it’s time for the first full installment of our stats. You can see where we were before the trip started here.
As you’ll see below, we ended up going over budget. We’ve definitely had a few teething problems with sticking to such a strict budget (our income is 1/3 of what it was before we quit our jobs last year.)
Having said that, some of the larger expenses we incurred in the past few weeks won’t be repeated each month, so hopefully we’ll do better in future months.
Without further ado, here are our road trip stats from Month 1.
Miles Driven
When we set off on January 1, our odometer read 79,378. We’re now at 81350 miles, so we drove 1,972 miles in January.
This is probably about the same number of miles as we’ll drive each month, although we’ll have to wait and see if I’m right about that. We had a long-ish drive from Virginia to South Carolina to start the trip which added to the distance traveled. Most months we’ll be driving to a new state though, so that’ll likely be repeated most months.

Money Spent
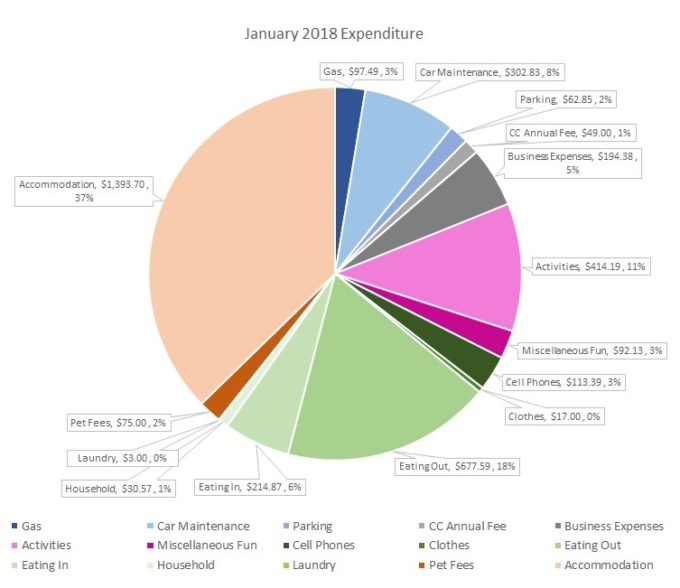
Our budget is $100 a day, so that meant our allowance for January was $3,100. The amount we actually spent was $3,737.99, so we were $637.99 over budget.
Oops!
As I mentioned earlier, some of this is because we overspent as it’s hard getting used to such a strict budget. I’m hopeful we’ll find our groove in the coming months and find ways to have fun without feeling like we’re depriving ourselves too much.
Pretty much all the overspend was due to several large one-off (or semi-one-off) expenses though. This includes ~$110 for both of us to take part in the Charleston Shrimp & Grits 5k – something we won’t be doing each month.
There’s $150 paid to Wyndham, although in return we got enough points for three free hotel nights, as well as a seven night stay elsewhere. That $150 will therefore save us more further down the road, so it was a worthwhile investment.
We paid the ~$100 annual license for some video editing software that Shae needs for some of the stuff she’s working on. In theory we could have paid for this monthly, but it would’ve doubled the annualized cost if we wanted to pay in installments, so this worked out cheaper overall.
Another large expense was ~$300 for six months of auto insurance. Again, we could’ve paid that monthly rather than twice annually, but installment charges would’ve made that more expensive overall too.
Those large expenses amount to ~$660 and won’t (or hopefully won’t!) be repeated each month. Seeing as that’s pretty much how much we went over budget, I’m not expecting us to exceed our allowance so much in the future.
Here’s a breakdown of our expenditure:
Points Earned
Seeing as half our nights were paid for using points and an additional nine nights were at Airbnbs (which don’t earn points), we didn’t earn a huge number of points this month.
Ten nights were spent in a couple of Hyatt Place hotels (here and here) using points, although we did still earn some points on those stays due to room charges, pet fees, etc.
Five nights were also spent at a Hampton Inn using points; we surprisingly earned a decent chunk of points on that stay too – read about how in this post.
- IHG Rewards Club – 25
- Hilton Honors – 13,730
- SPG – 1,268
- Marriott Rewards – 0
- World of Hyatt – 22,305 (20,000 were transferred from Chase Ultimate Rewards)
- Club Carlson – 5,308
- Choice Hotels – 1,888
- Wyndham Rewards – 45,000
- Hotels.com Welcome Rewards Credits – 3
- Chase Ultimate Rewards – 24,845
Points Redeemed
I mentioned above that half our nights were paid for using points, so we spent more points this month than we earned.
- IHG Rewards Club – 0
- Hilton Honors – 80,000
- SPG – 0
- Marriott Rewards – 80,000
- World of Hyatt – 45,000
- Club Carlson – 0
- Choice Hotels – 0
- Wyndham Rewards – 0
- Hotels.com Welcome Rewards Credits – 0
- Chase Ultimate Rewards – 20,000 (transferred to World of Hyatt)
Total Points Balances
Taking into account all the points earned and redeemed, here are our point balances going into February 2018.
- IHG Rewards Club – 539,307
- Hilton Honors – 685,733
- SPG – 132,779
- Marriott Rewards – 227,230
- World of Hyatt – 17,623
- Club Carlson – 359,238
- Choice Hotels – 36,353
- Wyndham Rewards – 45,000
- Hotels.com Welcome Rewards Credits – 9
- Chase Ultimate Rewards – 356,384
Blog Stats
Becky suggested in the comments below that we should include some blog-related stats, so here are January’s. We’ll provide this info in future posts too.
- Number of blog posts written – 28
- Page views – 10,749
Final Thoughts
So that’s where we are. The overspending in our first month wasn’t great, but hopefully that’ll be a one-off rather than a regular feature.
Despite several point redemptions, our points total didn’t get whittled down too much. We even built up larger balances in some of the loyalty schemes, so that’s positive.
Question
Are there any other stats or details you’d like us to include in this monthly series? If so, let us know what you’d be interested about in the comments below.
This is great, guys! I’m a data nerd, so that was a dangerous question to pose at the end. 🙂 It might be cool for those of us following along to see how many blog posts you write each month, and if your site traffic is growing. You wouldn’t have to give us raw numbers for that one if you didn’t want to. 🙂 I’m sure the further you go, the more people will be interested!
Ooh, good thinking – I’ll get the post updated in the next couple of days with that info 🙂
Over 10,000 page views–awesome!!
Thanks!
This is all really cool. I would be fun to see photos form your trip instead of what looks like stock photos. Numbers aren’t fun.
And maybe it’s because i’m thrify AF but 3100 seems so high, but good for you guys for knowing how to save and make it possible! what a dream!!
Kate, Thank you so much for your feedback. As for the photo on that post, yes the calculator is a stock photo, but the odometer is ours as is the chart. Our other posts are filled with images from our travel so I hope you have a chance to check them out because they are good (although I’m partial since many of them are mine 😉 )
As for the budget, I think as a monthly total it seems high, but we aren’t doing this in a camper or RV or through camping, we are driving our car and staying in hotels and Airbnb’s. So it’s a $100 USD a day budget for 2 people and 1 dog which includes accommodation (the max of which is $85 per night if we are paying cash, less if we are sharing an Airbnb with the host, or using points which we’ve been saving for years), things to do, food, gas and other incidentals like cell phones, dog care, car care, clothing, etc. If we do pay cash then we have $15 per day to play with. We know we went over with eating out last month (usually on days where we did something for free or worked in our hotel room so it was more of the local ‘activity’) but it was our first month so we’re hoping to learn through trial and error and thriftier folks (like yourself if you have great tips to share) on how do it at a max of $100 per day. 🙂 Thanks for your comment.
I’ve always been interested in doing a road trip and its something I’ll be adding to my travel bucket list. But honestly I would have no idea the true cost of long term road tripping so I found your post educational and has highlighted that I’d need to do a ton more research, budgeting and saving before I hit the road. Thanks..
Awesome- I’m so glad you’ve found some of the information useful 🙂
We love following the adventures of the Peppers and Mr. Truffles. Planning for year 1 of retirement and considering doing something similar. – Jeff, Lee-Ann and Mason O’Dell
This is so great!!! I’m so excited for y’all and glad you can ‘come along’ on our adventures for now until your own start!
I loved reading the stats and that gave me quite an idea of how well you have planned the whole trip. Way to go guys and I’m sure you will cover up that over budget soon. I would like to know one thing though as a reader, when you say you spend a particular amount in eating out, how many days in a month did you eat out?
Hiral,
Thank you that’s a great question. We ate out a total of 27 times. 3-4 of those were >$10 each for having drinks while working at Starbucks. So conservatively we ate out for an average of $28 per time. I hope that helps 🙂
Very interesting article! One thing that could be interesting to see is a graph plotting your monthly expenditure that you update each month – just to give a visual representation of how the budgeting is going – with a line across to show where the monthly budget line is.
Or an alternative idea would be to do the same thing but based on each state rather than per month – to give a visual idea as to whether some states end up being more expensive than others.
Not sure if I’ve explained clearly what I mean, but hopefully you get the gist!
Yep, I get it! I’ll put Shae on it as she’s more familiar with the graph-creating than I am 🙂