It doesn’t feel like long since we put together our stats for March, but here we are. One month ends, another begins and it’s time to share how we did last month.
In case you’re new to the blog, my wife and I are on a 5 year, 50 state road trip which started in January 2018. Each month we publish a post like this one listing our stats from the previous month. We share how much we spent, how many miles we drove, how many hotel points we earned and redeemed and more.
To give a bit of background, we went over budget our first two months, but we managed to rein our spending in enough to be slightly under budget last month.
At the beginning of April, I was optimistic that we’d be under budget again. That’s because most of the month was going to be spent staying with several different sets of friends in Ohio. Lower accommodation costs meant it was tempting to splurge elsewhere though.
Did we overspend though? Here’s how we did:
Miles Driven
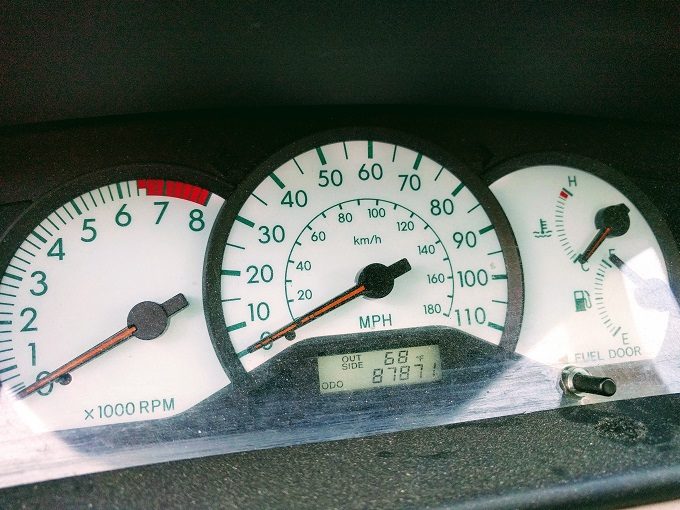
At the beginning of April, there were 86,170 miles on our car (a 2004 Toyota Corolla). We’d driven a total of 87,871 miles by the end of the month, which means we drove 1,701 miles in April.
That’s much less than in previous months and is largely because of us staying with friends. Partly because we did less ‘traveling’ in April as we were more focused on hanging out with our friends and partly because when we did go out it was often in their vehicles.
In May we’re traveling from Ohio to Vermont to Canada, so I’d imagine our mileage will be closer to double that.
Money Spent
Our budget is $100 per day, so that meant our budget for April was $3,000. That has to cover all our expenses – accommodation, cellphones, food, activities, gas, etc.
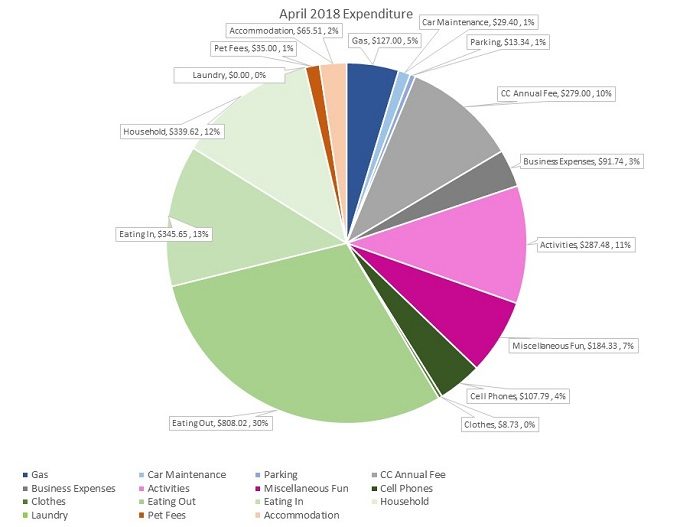
As I mentioned earlier, staying with friends meant our accommodation spending was significantly less. Knowing this though, we ended up splurging more on other stuff, especially eating out. It wasn’t just Cincinnati chili though, as we had a few nicer, more expensive dinners in there too. It’s still shocking to see that we spent ~$1,150 on food (total of eating out and in) in April though.
The good news is that we were still under budget. We spent $2,722.61, so that put us $277.39 under budget. That’s not as good as it could’ve been, but under budget is still under budget.
Here’s a breakdown of our spending for April 2018…
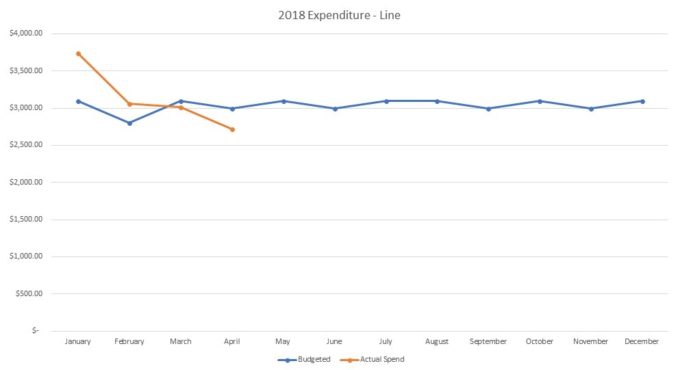
…and a line graph with our spending so far this year:
Points Earned
24 of 30 days in April was spent staying with friends, so we didn’t earn a large number of points from hotel stays. In fact, we didn’t have any paid hotel stays this month.
We still earned some points along the way though. Here’s a list of the points we earned in April:
- IHG Rewards Club – 0
- Hilton Honors – 31,194 (30,000 from referring a couple of people to a Hilton credit card)
- SPG – 612
- Marriott Rewards – 10,200 (10,000 was a correction as Marriott overcharged us on an award stay)
- World of Hyatt – 0
- Radisson Rewards (used to be called Club Carlson) – 4,370
- Choice Hotels – 0
- Wyndham Rewards – 0
- Hotels.com Welcome Rewards Credits – 0
- Chase Ultimate Rewards – 34,050 (most of these came from referring a couple of people to a Chase credit card)
Points Redeemed
As we were staying with friends for most of April, we hardly redeemed any points. In fact, the only redemption was with IHG for a stay in June.
- IHG Rewards Club – 70,000
- Hilton Honors – 0
- SPG – 0
- Marriott Rewards – 0
- World of Hyatt – 0
- Radisson Rewards (used to be called Club Carlson) – 0
- Choice Hotels – 0
- Wyndham Rewards – 0
- Hotels.com Welcome Rewards Credits – 0
- Chase Ultimate Rewards – 0
Total Points Balances
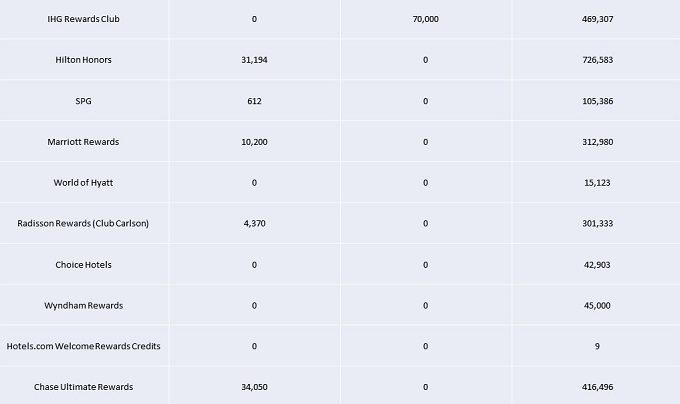
Based on all the points we earned and redeemed, here are our total points balances at the end of April 2018.
- IHG Rewards Club – 469,307
- Hilton Honors – 726,583
- SPG – 105,386
- Marriott Rewards – 312,980
- World of Hyatt – 15,123
- Radisson Rewards (used to be called Club Carlson) – 301,333
- Choice Hotels – 42,903
- Wyndham Rewards – 45,000
- Hotels.com Welcome Rewards Credits – 9
- Chase Ultimate Rewards – 416,496
Here’s that information in table format seeing as we’ve received a request for that before.
Blog Stats
Here are some stats relating to this blog:
- Number of blog posts published – 26
- Page views – 12,060
Final Thoughts
It’s a little disappointing that we didn’t save more than $277.39, but at least that’s two months in a row where we’ve underspent.
I’ve a feeling May will be a bigger challenge. Our accommodation costs will be much higher than April, so we’ll have to be much more careful with our other spending, especially when eating out.
Question
Is there any other information or stats you’d like us to share in these monthly posts? If so, let us know in the comments below.
Loving the monthly stats. With all the hiking you’re doing, maybe you should include your hiking mileage too 🙂
Have you noticed your page views going up each month, or are they about the same?
Yep, they seem to be increasing each month. These stats don’t necessarily reflect that as clearly as they’re the total for the month, so as some months have more days than others, they’ll have more pageviews.