Our road trip slowed right down in 2020 due to COVID. 2021 saw an improvement in our willingness and ability to explore the US thanks to vaccinations and visiting states where we’d have access to a lot more outdoor activities.
Every January I like to publish a post sharing lots of different info and stats relating to our travel from the previous year, so our stats for 2021 are a little more interesting than they were for 2020.
For reference, here are our posts for previous years:
And here’s a roundup of all our stats for 2021:
Miles Driven
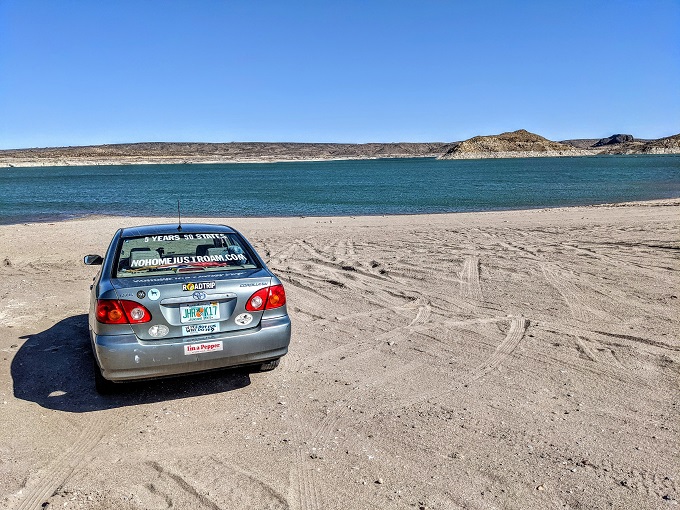
We started 2021 with 150,402 miles on our car’s odometer. By the end of the year its reading was 170,461 which means we drove 20,059 miles last year.
For comparison, here’s our mileage from previous years:
- 2020 – 18,375
- 2019 – 25,006
- 2018 – 27,643
Number Of Countries Visited
Three. We’d hoped to visit the UK (where I’m from) in the spring, but we cancelled those plans because of so much uncertainty about travel restrictions.
We did get to go overseas for Shae’s 40th birthday though, flying to Dubai, Egypt and Jordan for a week each. Check out this post for the start of our series of posts from that trip; links to everything we did during that trip can be found at the bottom of that post.

Number Of Cities Stayed In (Officially)
26
Number Of Cities Stayed In (Unofficially)
33. This total includes cities we stayed in a night or two while moving from one place to another.
Number Of States Visited (Officially)
6, although only 5 of those were “new” states for the road trip. The other one – Texas – was one we visited in the first year of our road trip.
Number Of States Visited (Unofficially)
11. The other 5 states were just ones that we stopped over in for a night or two.
Number Of Hotel Brands Stayed At
22. That’s not quite as many as we stayed at back in 2019 (27), but it did include several brands we’d never stayed at before:
- Clarion Inn
- Courtyard
- Homewood Suites
- Sonesta ES Suites
- SureStay by Best Western
- Westin
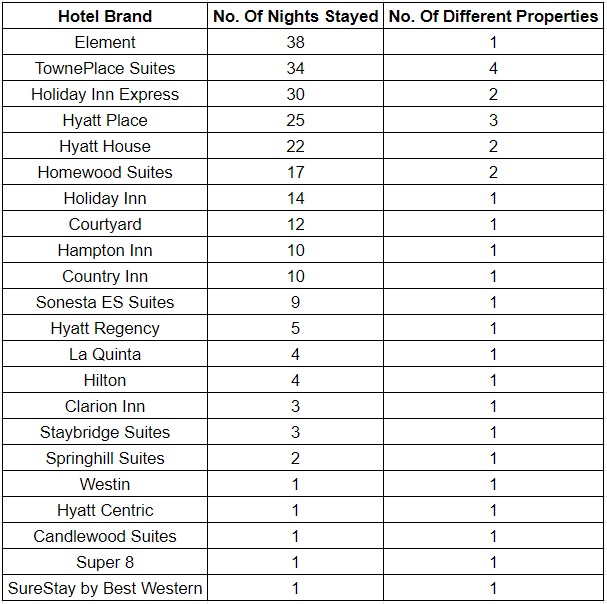
Here’s a list of how many nights we spent at each brand:
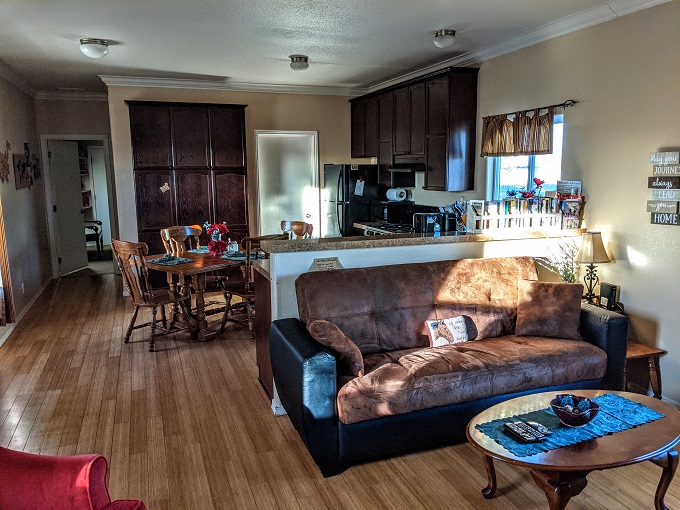
Number Of Nights In Airbnbs
96. That’s one more than we stayed at in 2020 which I’m a little surprised about because it felt like we spent more time in Airbnbs that year. Exactly half of those 96 nights occurred in the last three months of the year, so our Airbnb stays earlier in the year were less frequent.
Average Accommodation Cost
$38.77 per night. That’s a little less than I thought it was going to be because it felt like we had more paid nights in hotels in 2021.
For comparison, our average accommodation spend in 2020 was $42.67, so we spent less last year than the previous year. That’s still not as good as 2019 though when our average nightly spend was $24.79.
If you’re wondering how we can afford to spend so relatively little per night on hotels and Airbnbs, it’s because we have a good stash of hotel points which reduces our average nightly cost.

Paid Nights Vs. Award Nights
We paid cash for 181 nights in 2021 and used points or free night certificates for 162 nights. That doesn’t add up to 365 because I’ve only included hotels and Airbnbs we stayed at on the road trip, not the hotels we stayed at while in Dubai, Egypt and Jordan.
Total Pet Fees
We were due to pay $2,295 in pet fees at hotels in 2021. Some of those hotels didn’t end up charging us a fee, while others charged a lower fee than expected, so the amount we actually spent was $1,035.95. That means we paid less than half the amount in pet fees that we were expecting which helped us not go overbudget for the year as a whole by as much as we should have.

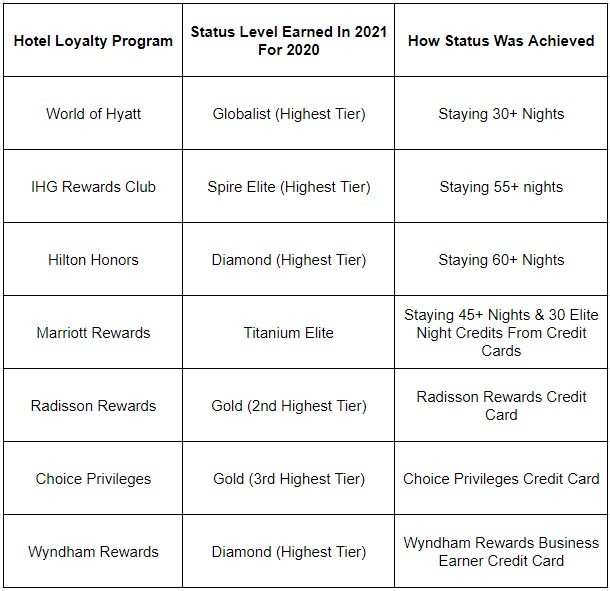
Hotel Status Levels
Even though we spent more nights in Airbnbs during 2021 than we did in 2020, we still managed to earn top tier or almost-top tier status with most hotel chains. Some hotel chains reduced the requirements for earning status due to the pandemic, so that’s one reason I was able to earn Spire Elite status with IHG as normally that would require 75 nights.
Normally we focus earning status on only my accounts, but due to the reduced requirements we managed to earn Hyatt Globalist, Marriott Titanium, IHG Spire and Hilton Diamond for Shae too.
Average Daily Spend
We spent $35,577.23 in 2021, but we’d budgeted for $34,850 due to spending some of the year overseas. That means we overspent by an average of a couple of bucks per day which isn’t too bad.
Number Of Blog Posts Published
We published 152 blog posts in 2021. That’s more than the 129 posts we published in 2020, although fewer than the 224 posts in 2019 and 274 in 2018.

Total Website Visitors
We had 234,389 people visit the website in 2021 versus 157,430 in 2020.
Total Page Views
We had 341,825 pageviews in 2021 versus 235,599 in 2020, 304,588 in 2019 and 160,788 in 2018. That was therefore our best year of readership, although a lot of that came in the first half of the year. For some reason traffic dropped off after June, so hopefully it recovers more during 2022.
Question
Are there any other numbers you’re curious about from the fourth year of our road trip? Let me know in the comments below and I’ll try to provide them 🙂
[…] 2021 […]