COVID meant that 2020 was a bit of a wash for our road trip as our travel slowed right down. We tried to be as responsible as we could seeing as we don’t have a home, so we moved less frequently and didn’t do many activities.
Our road trip still sort of continued though, so here’s our annual look back at the previous 12 months of our road trip to see how many miles we drove, how much we spent on accommodation, how many cities we visited and more.
Miles Driven
2020 began with 132,027 miles on our odometer, while by the end of the year its reading was 150,402. That means we drove a total of 18,375 miles in 2020 compared to 25,006 miles in 2019 and 27,643 miles in 2018.
On the one hand, it’s not surprising that we drove significantly less as we traveled a lot less due to the pandemic. However, we’d started the year in Tennessee, then drove west, then headed back east, then started heading west again, so I thought we’d have racked up a few more miles than that.
Number Of Countries Visited
A big, fat zero. We were due to visit Europe in the fall, but that trip didn’t go ahead for obvious reasons.
Number Of Cities Stayed In (Officially)
21.

Number Of Cities Stayed In (Unofficially)
31. This total includes cities we stayed in a night or two while moving from one place to another.
Number Of States Visited (Officially)
10, although only 6 of those were “new” states for the road trip. 4 of the others – Virginia, Ohio, Colorado and Kansas – were states we’d visited in the past. I don’t feel like those 4 states were “unofficial” though because we still ended up doing stuff in those places which we hadn’t the first time round.
Number Of States Visited (Unofficially)
16. The other 6 states were just ones that we stopped over in for a night or two.
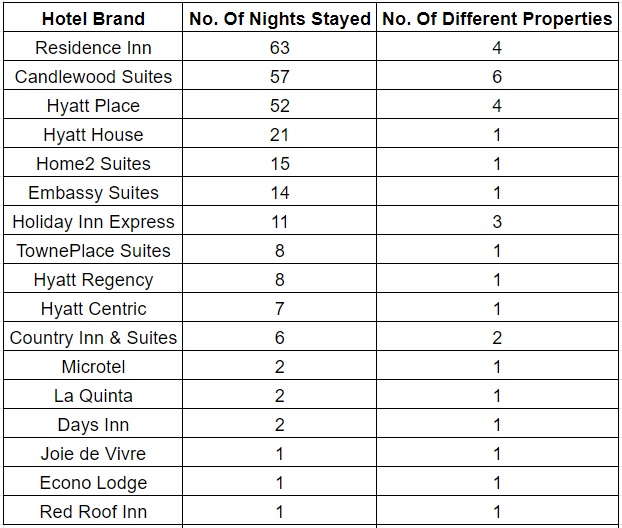
Number Of Hotel Brands Stayed At
17. We stayed at 27 different brands in 2019, so this big drop is because we often stayed 3-6 weeks in the same hotel rather than our normal 5-7 days. Here’s a breakdown of all those nights:
Number Of Nights In Airbnbs
95. That compares to 63 in 2019 and 103 in 2018. Those 95 nights were spent in only 3 different locations – Pueblo, CO, Wichita, KS and Inverness, FL.
Average Accommodation Cost
$42.67. While that’s not bad seeing as it’s less than half our budget of $100 per day for the road trip, it’s significantly higher than the average of $24.79 we spent per night in 2019.
The reason our average cost increased so much is because we often stayed in the same location for 3-6 weeks. That made it harder to use points to cover the entire stay, plus we were able to get some low paid rates. Considering we spent more than $6,500 extra on accommodation in 2020, I’m glad that we still managed to stay under budget for the year.
Paid Nights Vs. Award Nights
We paid cash for 260 nights in 2020 and used points or free night certificates for 106 nights. The paid nights include both hotel and Airbnb stays.
Total Pet Fees
We were due to pay $2,495 in pet fees at hotels in 2020. Thankfully some properties actively waived the pet fee, while others simply neglected to charge us for them. That meant we ended up only paying $1,200.35, so just under half of what it should’ve cost us. Saving almost $1,300 was therefore a fantastic result!

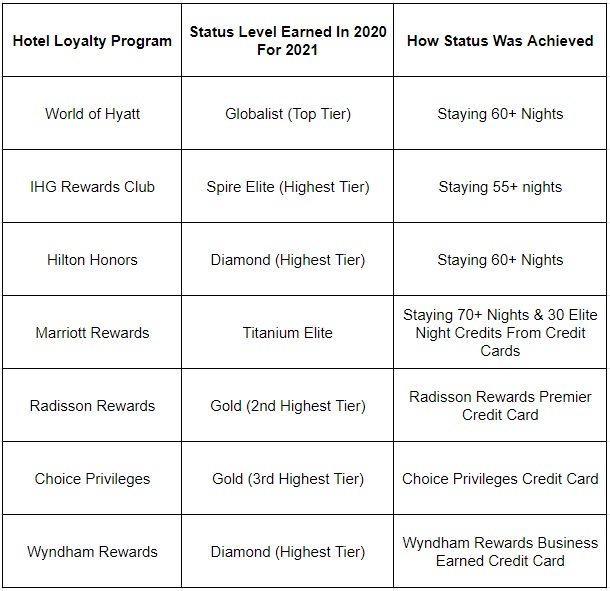
Hotel Status Levels
Even though we spent more nights in Airbnbs during 2020 than we did in 2019, we still managed to earn top tier or almost-top tier status with most hotel chains. Some hotel chains reduced the requirements for earning status due to the pandemic, so that’s one reason I was able to earn Spire Elite status with IHG as normally that would require 75 nights.
Average Daily Spend
We spent $35,898.16 in 2020. That means we spent an average of $98.08 per day versus our budget of $100 per day. That’s slightly higher than what we spent per day in 2019, but it’s still pleasing that we managed to stay under budget overall.
Number Of Blog Posts Published
We published 129 blog posts in 2020. The previous year we wrote 224 posts and the year before that we published 274.
That’s a significant drop and is mainly due to COVID as we did far less stuff to write about last year than we had in previous years on the road trip.
Total Website Visitors
We had 157,430 people visit the website in 2020 versus 209,841 in 2019. It’s disappointing that there was such a large drop, but that also seems to be due to COVID. When your blog is about travel and travel grinds to a halt, far fewer people are going to come across your site.
Given the pandemic, it’s not surprising that some of our most popular posts were ones we’d written about hikes and other outdoor activities.

Total Page Views
We had 235,599 pageviews in 2020 versus 304,588 in 2019 and 160,788 in 2018. Hopefully 2021 sees a recovery to 2020 levels or beyond.
Question
Are there any other numbers you’re curious about from the third year of our road trip? Let me know in the comments below and I’ll try to provide them 🙂
Curious about logistics with your traveling kitchen and Hyatt Place properties. Do you advise them you are cooking? Do they even care?
I don’t think they care, but I never mention. We don’t cook using anything with a flame, so I figure using an Instant Pot is similar to using a microwave in that they’re both electric devices.
Great stuff, Stephen! Here’s to a healthy 2021.
Thanks, you too!
I liked the picture of Truffles at the Roanoke Valley overlook by the Mill Mountain Star!
Thanks! She was looking especially cute that day 🙂