If you’re a regular reader, you’ll know that each month we publish our road trip stats. We’d mentioned in our stats for December 2022 that we’d be combining our January and February 2023 stats because we were going to be overseas for a month during that time (see the first post in that international trip series here).
Well, once we got back from that trip we had a ton more posts to write than anticipated and I wanted to get those all finished rather than adding a stats post in the middle of them. We didn’t get them finished until mid-March, at which point I figured it would make more sense to wait another couple of weeks to do a January-March stats post instead, so here it is!
Miles Driven
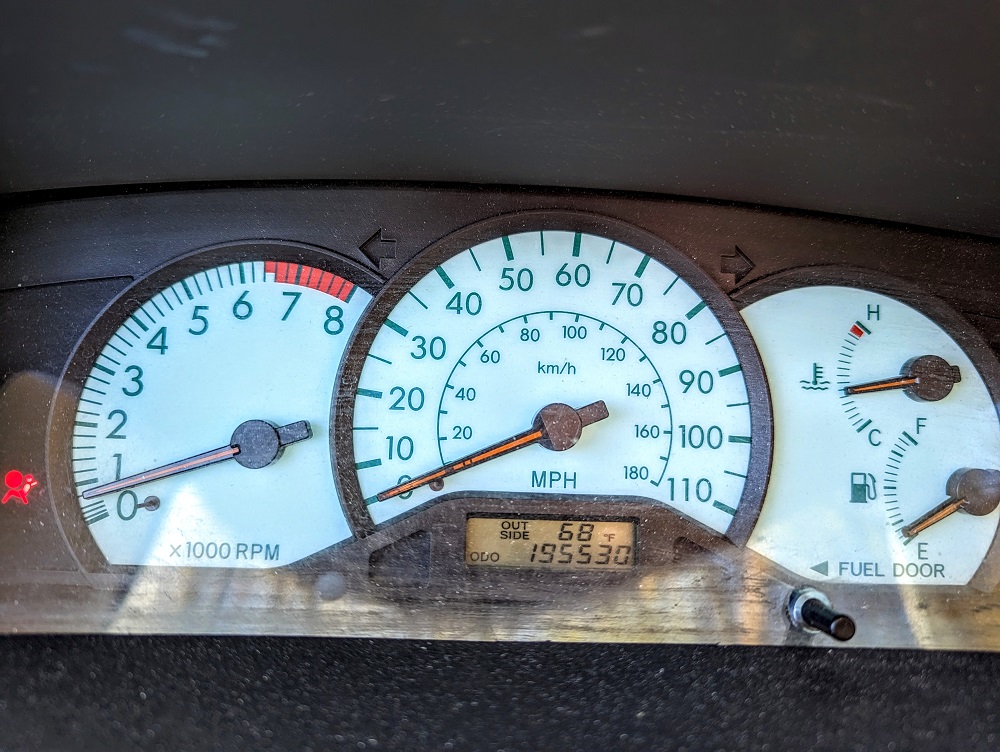
2022 ended with 191,930 on our car’s odometer. At the end of February it was at 193,487 which means we drove 1,557 miles in those first two months (remembering that we were away for a month during that time). At the end of the following month its reading was 195,530 which means we drove 2,043 miles in March.
Looking ahead to our mileage for April, I’m going to predict that we’ll drive 2,400 miles in April. We started the month in Little Rock, AR and are currently in St Louis, MO. We’re then heading to Kansas City, MO and then it’s off to Sioux Falls, SD and Rapid City, SD by the end of the month. In theory that’s only ~1,600 miles, but with the extra driving to and from activities, errands, etc., I figured it’ll end up being closer to 2,400.
Money Spent
Seeing as we were away for a month from early January to early February, we halved our budgeted amount for those two months because these stats are only meant to reflect our road trip expenditure. With a daily budget of $125 and 31 days in January and 28 in February, that meant our spending allowance for January was $1,937.50 and for February it was $1,750. March was back to normal on the road trip, so our budgeted amount was $3,875.
As a result, our total budget for the first three months of 2023 was $7,562.50. Over the course of those three (well, two really) months we spent a total of $7,151.35, so we were $411.15 under budget.
That’s a fantastic result because it was originally looking like we were going to be well over budget. What flipped that was the Capital One Shopping portal. I’d gotten some targeted offers from the portal for 24% cashback on IHG reservations last year. We’ve stayed with IHG a few times since then and several of those tracked transactions became payable. We account for that cashback in our stats, so that moved us from being many hundreds of dollars over budget to many hundreds under budget. Greg has written about the Capital One Shopping portal’s targeted – and extremely lucrative – offers before at Frequent Miler, so check out this post for more details.
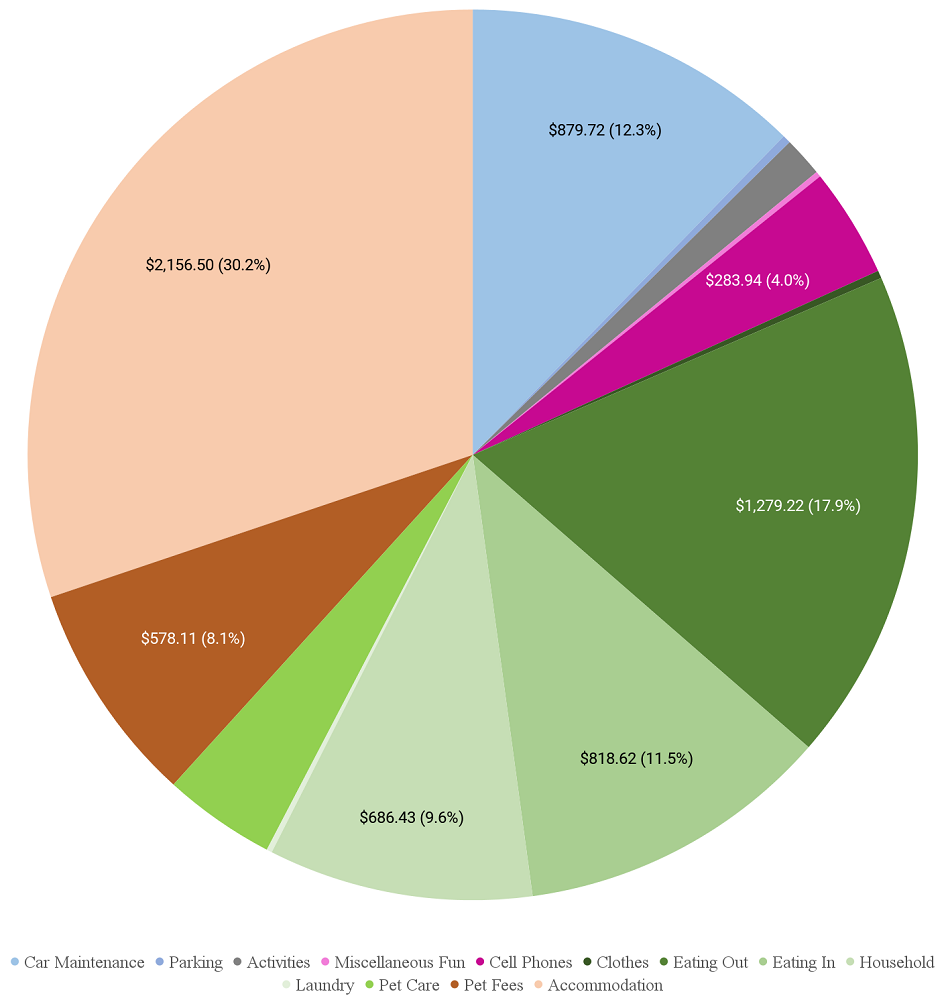
Here’s a breakdown of our spending for January-March…
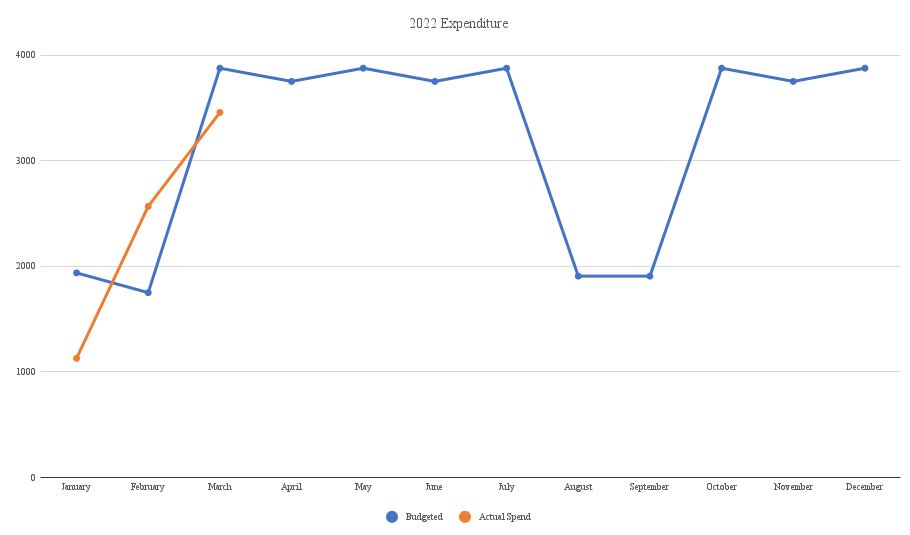
…and here’s a chart tracking our spending this year so far.
Looking ahead to our spending for April, it’s hard to know where our budget will end up. We’re only spending a week or so in accommodation paid for with cash – the rest of our nights are in hotels booked with points. That means our accommodation expenditure will be less than normal, but our spending on eating out in St Louis and Kansas City will likely be far higher than average. I’m therefore hoping that we’ll manage to stick to our budget, but it wouldn’t surprise me if I wince when looking at the numbers towards the end of the month!
Accommodation Cost
In this section I normally go into a little bit of detail about each place we booked and how we maximized each stay to reduce how many points we had to redeem or cash we had to pay.
Seeing as this latest road trip stats post is covering a longer time period, I’ll try to be a little more concise so that this section doesn’t end up being one long essay. I’ll only include places we stayed on the road trip rather than on our trip to Mauritius and South Africa, but you can check out posts from that series because in the reviews I did of our hotels I shared how we paid for those. That link is for the first hotel we stayed at – the Hilton Mauritius Resort & Spa – but if you scroll to the bottom of that post there are links to every post from that trip.
January 1-8: Candlewood Suites Virginia Beach Town Center, VA (see a past review here). Booked with IHG One Rewards points which came to 13,388 points per night on those nights. That was less than it should’ve been thanks to the 4th night free benefit & 10% points rebate from our IHG credit cards. We bought those points for 0.5 cents each, so on average it cost us $66.94 per night.
February 6-13: Portsmouth, VA at Shae’s mom and stepdad’s, so it was free. We were initially only due to stay there until February 10, but I got sick and so we stayed an extra few days.
February 10-20: Airbnb in Wilmington, NC. We’d booked this from February 10-17 initially, but added three nights seeing as we were delayed getting there. This cost an average of $117.99 per night, but we paid with Airbnb gift cards bought at a discount, so our net cost was $106.19 per night.
February 20-27: Hyatt House Raleigh/RDU/Brier Creek, NC. This was booked using 5,000 World of Hyatt points per night. We used a Suite Upgrade Award to upgrade to a one bedroom suite.
February 27-March 9: Candlewood Suites Asheville Downtown, NC. This was booked with IHG One Rewards points and cost an average of 13,230 points per night. Once again, that was lower than it would’ve been thanks to the 4th night free and 10% points rebate benefits from our IHG credit cards. We’d bought those points for 0.5 cents each, so the average cost was $66.15 per night which is far cheaper than the cash rate at hotels in Asheville normally.
March 9-13: Hyatt Place Atlanta Downtown, GA. On our way down to Arkansas we stopped for a few nights in Atlanta. It cost 9,500 World of Hyatt points for the first night and 8,000 points per night for the other three nights.
March 13-16: Hyatt Place Birmingham/Hoover, AL. We then stopped a few nights in Birmingham, AL as we had to work. This cost 5,000 World of Hyatt points per night.
March 16-23: Staybridge Suites Hot Springs, AR (see my review here). Shae and I paid cash for this stay as it was pretty good value at $110.39 per night including tax. This was for a studio suite with a full kitchen.
March 23-30: Airbnb in Garfield, AR (here’s the listing). We wanted to stay near Bentonville and this was our best value option, costing $78.98 per night. We paid with Airbnb gift cards bought at a discount, so our net cost was $71.08 per night.
March 30-April 1: Holiday Inn Little Rock-Presidential-Downtown, AR (see my review here). We stayed here a total of four nights, although only two of those nights fell in March. IHG One Rewards points were used to pay for our stay, with the 4th night free and 10% points rebate once again coming in handy. As a result, we redeemed an average of 17,550 points per night which had cost us $87.75 per night to buy those points.
Hotel Points Earned
Seeing as we’re covering a three month period, we had quite a lot of earning and redeeming activity in that time. As always, the points we earned came about from a number of ways – points earned from stays, points credited back after cancelling award bookings, credit card signup bonuses, points earned from credit card spend, points transferred from a transferable currency (e.g. from Chase Ultimate Rewards to Hyatt or from Capital One to Wyndham Rewards), etc.
Here’s a breakdown of everything we earned in the first quarter of 2023.
- IHG One Rewards – 82,799
- Hilton Honors – 43,515
- Marriott Bonvoy – 22,260
- World of Hyatt – 330,011
- Radisson Rewards – 0
- Choice Privileges – 40
- Wyndham Rewards – 241,209
- Hotels.com Rewards Credits – 0
- Chase Ultimate Rewards – 85,939
- Capital One – 248,731
Hotel Points Redeemed
We made a bunch of award bookings in the first three months of the year, so here’s a breakdown of all the points we used to book those stays:
- IHG One Rewards – 468,400
- Hilton Honors – 280,000
- Marriott Bonvoy – 0
- World of Hyatt – 223,000
- Radisson Rewards – 0
- Choice Privileges – 8,000
- Wyndham Rewards – 307,500
- Hotels.com Rewards Credits – 0
- Chase Ultimate Rewards – 296,000
- Capital One – 237,000
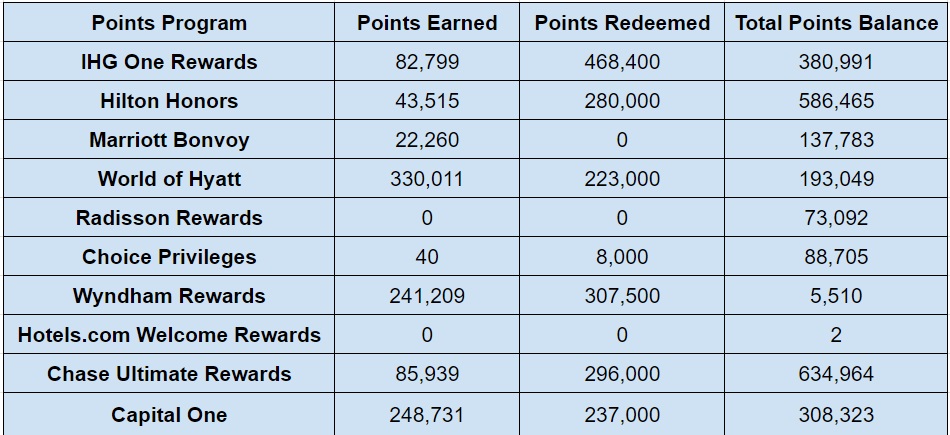
Total Hotel Points Balances
As a result of all that activity, here’s how our total hotel points balances ended up at the end of March.
- IHG One Rewards – 380,991
- Hilton Honors – 586,465
- Marriott Bonvoy – 137,783
- World of Hyatt – 193,049
- Radisson Rewards – 73,092
- Choice Privileges – 88,705
- Wyndham Rewards – 5,510
- Hotels.com Rewards Credits – 2
- Chase Ultimate Rewards – 634,964
- Capital One – 308,323
Here’s all that info in a table in case you find it easier to view that way:
Hotel Free Night Certificates
We ended up redeeming some of our hotel free night certificates for our stays in Mauritius, but we also received a few more in that time (due to them being a benefit when renewing our credit cards), so here’s how many we have left:
- IHG (up to 40,000 points per night) – 3
- Hilton (any property worldwide) – 4
- Marriott (up to 35,000 points per night) – 1
- Marriott (up to 40,000 points per night) – 0
- Hyatt (category 1-4) – 0
- Hyatt (category 1-7) – 1
Blog Stats
We ended up averaging 10 posts per month from January to March. We currently have a bit of a backlog of posts as we need to share about everything we did in Arkansas, so stay tuned for all those over the next few weeks!
January
- Number of blog posts published – 11
- Page views – 19,941
February
- Number of blog posts published – 9
- Page views – 18,774
March
- Number of blog posts published – 10
- Page views – 23,159
Final Thoughts
Our stats were much better than I’d originally been anticipating. I’d thought that we’d end up far over budget, but the cashback from a shopping portal for past hotel stays saved it.
Our overall hotel points balances went down in the first quarter, but with only 21 months left on the road trip and a fair bit of our accommodation booked for the rest of this year, we’re still in a good position to not have to pay cash for all our stays.
[…] publishing last month’s stats, I’d mentioned that I wasn’t sure how our budget would end up in […]